Equipment Damage Curves Conductors |
||||||||||||||||||||||||||||||||||||||||||||||||||||||||||||||||||||||||||||||||||||||||||||||||||||||||||||||||||||||||||||||||||||||||||||||
|
The information presented in this application guide is for review, approval, interpretation and application by a registered professional engineer only. SKM disclaims any responsibility and liability resulting from the use and interpretation of this information. Reproduction of this material is permitted provided proper acknowledgement is given to SKM Systems Analysis Inc. Purpose The purpose of this guide is to provide basic information about conductor damage curves and characteristic landmarks necessary for plotting on time-current curves (TCC), for the purpose of equipment overcurrent protection. Ampacity The rated continuous current carrying capacity of the conductor at a referenced ambient temperature, allowable temperature rise, geometry and installation. For bare overhead conductors an ambient air temperature of 40°C is typical. For underground insulated power cables an ambient earth temperature of 20°C is typical. Temperature correction factors are then given to adjust the base ampacity for other ambient temperature levels. If a cable is loaded continuously above rated ampacity the insulation temperature design limits will be exceeded. This will lead to loss of insulation life, not instantaneous failure. If a bare overhead conductor is loaded continuously above rated ampacity the mechanical strength of the conductor is reduced. This will lead to a loss of mechanical life, not instantaneous failure. Table 1 summarizes typical allowable conductor temperature limits under short circuit, emergency overload and normal operating conditions. |
||||||||||||||||||||||||||||||||||||||||||||||||||||||||||||||||||||||||||||||||||||||||||||||||||||||||||||||||||||||||||||||||||||||||||||||
| Table 1 Typical conductor operating temperature limits | ||||||||||||||||||||||||||||||||||||||||||||||||||||||||||||||||||||||||||||||||||||||||||||||||||||||||||||||||||||||||||||||||||||||||||||||
|
||||||||||||||||||||||||||||||||||||||||||||||||||||||||||||||||||||||||||||||||||||||||||||||||||||||||||||||||||||||||||||||||||||||||||||||
| The ampacity landmark is located in the top decade of a TCC at 1000 seconds. Emergency Overload Limit Curve Conductor overcurrent operating limit that if exceeded will reduce the insulation life of a cable or reduce the mechanical life of a bare overhead conductor beyond an acceptable design loss of life limit. Cable limit curves are based on the thermal inertia of the conductor, insulation and surrounding material. As a result, it can take from 1 to 6 hours for the temperature of a cable to stabilize after a change in load current. Therefore, under these emergency operating conditions, currents much greater than the rated ampacity can be supported. Tables 2 and 3 provide factors and percent overload capability for various installations. |
||||||||||||||||||||||||||||||||||||||||||||||||||||||||||||||||||||||||||||||||||||||||||||||||||||||||||||||||||||||||||||||||||||||||||||||
| Table 2 Cable K factors | ||||||||||||||||||||||||||||||||||||||||||||||||||||||||||||||||||||||||||||||||||||||||||||||||||||||||||||||||||||||||||||||||||||||||||||||
|
||||||||||||||||||||||||||||||||||||||||||||||||||||||||||||||||||||||||||||||||||||||||||||||||||||||||||||||||||||||||||||||||||||||||||||||
| Table 3 Emergency overload current at 40°C ambient | ||||||||||||||||||||||||||||||||||||||||||||||||||||||||||||||||||||||||||||||||||||||||||||||||||||||||||||||||||||||||||||||||||||||||||||||
|
||||||||||||||||||||||||||||||||||||||||||||||||||||||||||||||||||||||||||||||||||||||||||||||||||||||||||||||||||||||||||||||||||||||||||||||
|
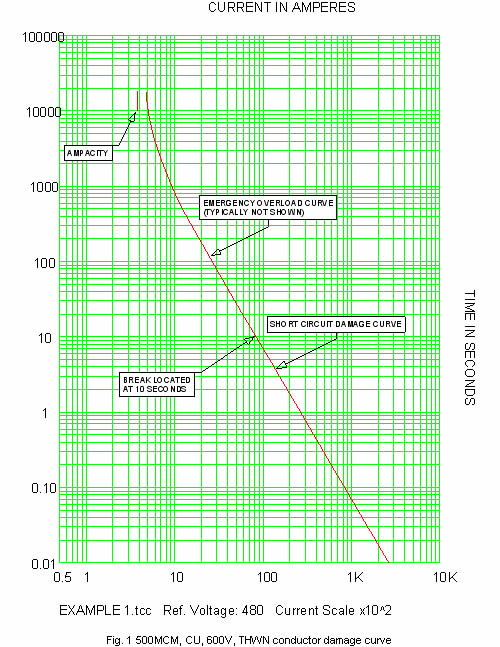
Similar methods exist to determine the limit curve for bare overhead conductor applications, but are not covered in this guide. Emergency overload curves are typically not shown on a TCC. However, when shown, are plotted in the upper 2 decades of the TCC. Short Circuit Damage Curve Curve that describes the conductor short circuit current operating limit, which if exceeded, will damage the conductor insulation. The curve is calculated assuming all heat is absorbed by the conductor metal, with no heat transmitted from the conductor to the insulation. Separate equations are given for copper and aluminum cables. Both equations relate conductor temperature rise to conductor size, fault current magnitude and fault duration. Insulated copper conductors t = 0.0297 log10 [(T2+234) / (T1+234)] (A/I)2 (1) Insulated aluminum conductors t = 0.0125 log10 [(T2+228) / (T1+228)] (A/I)2 (2) For bare conductors the short circuit damage temperature limit is much higher than those listed for insulated conductors. In this case the curve describes the conductor short circuit current operating limit at which the maximum acceptable loss in conductor mechanical strength is reached. Therefore, if this limit is exceeded, the conductor will be damaged. For bare stranded aluminum conductors the upper temperature limit is 340ºC (300º rise over a 40ºC ambient). For bare stranded ACSR conductors the upper temperature limit is 645ºC (605º rise over a 40ºC ambient). Bare stranded aluminum conductors t = (0.0671A/I)2 (3) Bare stranded ACSR conductors t = (0.0862A/I)2 (4) where: A = conductor area – circular mils I = short circuit current – RMS amperes t = time of short circuit – 0.01 to 10 seconds T1 = rated insulation operating temperature limit T2 = rated maximum insulation short circuit temperature limit Example 1 Plot the conductor landmarks for 3-1/C, 500kCM, THWN copper cables installed in metallic conduit on a 480V distribution system. Solution FLA from NEC table 310.16 is 380A Emergency overload points calculated from Tables 2 and 3 |
||||||||||||||||||||||||||||||||||||||||||||||||||||||||||||||||||||||||||||||||||||||||||||||||||||||||||||||||||||||||||||||||||||||||||||||
|
||||||||||||||||||||||||||||||||||||||||||||||||||||||||||||||||||||||||||||||||||||||||||||||||||||||||||||||||||||||||||||||||||||||||||||||
| Damage points calculated from (1) using: A = 500,000 cmils t = time of short circuit – 0.01 to 10 seconds T1 = 75°C (Table 1) T2 = 150°C (Table 1) |
||||||||||||||||||||||||||||||||||||||||||||||||||||||||||||||||||||||||||||||||||||||||||||||||||||||||||||||||||||||||||||||||||||||||||||||
|
||||||||||||||||||||||||||||||||||||||||||||||||||||||||||||||||||||||||||||||||||||||||||||||||||||||||||||||||||||||||||||||||||||||||||||||
| The results are plotted in figure 1. | ||||||||||||||||||||||||||||||||||||||||||||||||||||||||||||||||||||||||||||||||||||||||||||||||||||||||||||||||||||||||||||||||||||||||||||||
 |
||||||||||||||||||||||||||||||||||||||||||||||||||||||||||||||||||||||||||||||||||||||||||||||||||||||||||||||||||||||||||||||||||||||||||||||
| Fig. 1 500MCM, CU, 600V, THWN conductor damage curve | ||||||||||||||||||||||||||||||||||||||||||||||||||||||||||||||||||||||||||||||||||||||||||||||||||||||||||||||||||||||||||||||||||||||||||||||
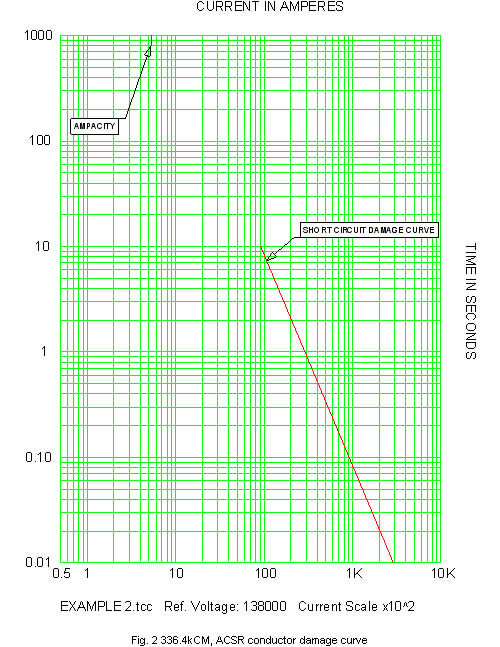
| Example 2 Plot the conductor landmarks for 336.4 kCM ACSR conductors installed on a 138kV aerial distribution system. Solution FLA from the Electrical Transmission and Distribution Reference Book is 530A Damage points calculated from (4) using: A = 336,400 cmils t = time of short circuit – 0.01 to 10 seconds |
||||||||||||||||||||||||||||||||||||||||||||||||||||||||||||||||||||||||||||||||||||||||||||||||||||||||||||||||||||||||||||||||||||||||||||||
|
||||||||||||||||||||||||||||||||||||||||||||||||||||||||||||||||||||||||||||||||||||||||||||||||||||||||||||||||||||||||||||||||||||||||||||||
| The results are plotted in figure 2. | ||||||||||||||||||||||||||||||||||||||||||||||||||||||||||||||||||||||||||||||||||||||||||||||||||||||||||||||||||||||||||||||||||||||||||||||
 |
||||||||||||||||||||||||||||||||||||||||||||||||||||||||||||||||||||||||||||||||||||||||||||||||||||||||||||||||||||||||||||||||||||||||||||||
| Fig. 2 336.4kCM, ACSR conductor damage curve | ||||||||||||||||||||||||||||||||||||||||||||||||||||||||||||||||||||||||||||||||||||||||||||||||||||||||||||||||||||||||||||||||||||||||||||||
| References Other Application Guides offered by SKM Systems Analysis at www.skm.com |
||||||||||||||||||||||||||||||||||||||||||||||||||||||||||||||||||||||||||||||||||||||||||||||||||||||||||||||||||||||||||||||||||||||||||||||
| • Aluminum Electrical Conductor Handbook, The Aluminum Association Inc., Washington, D.C., 3rd edition, 1989. • Electrical Transmission and Distribution Reference Book, ABB Power T&D Company, Raleigh, North Carolina, 1997. |
||||||||||||||||||||||||||||||||||||||||||||||||||||||||||||||||||||||||||||||||||||||||||||||||||||||||||||||||||||||||||||||||||||||||||||||
| The latest revision of: | ||||||||||||||||||||||||||||||||||||||||||||||||||||||||||||||||||||||||||||||||||||||||||||||||||||||||||||||||||||||||||||||||||||||||||||||
| • IEEE Std 242, IEEE Recommended Practice for Protection and Coordination of Industrial and Commercial Power Systems (IEEE Buff Book) | ||||||||||||||||||||||||||||||||||||||||||||||||||||||||||||||||||||||||||||||||||||||||||||||||||||||||||||||||||||||||||||||||||||||||||||||
| back to Application guides | ||||||||||||||||||||||||||||||||||||||||||||||||||||||||||||||||||||||||||||||||||||||||||||||||||||||||||||||||||||||||||||||||||||||||||||||