Equipment Damage Curves Capacitors
The information presented in this application guide is for review, approval, interpretation and application by a registered professional engineer only. SKM disclaims any responsibility and liability resulting from the use and interpretation of this information.
Reproduction of this material is permitted provided proper acknowledgement is given to SKM Systems Analysis Inc.
Purpose
The purpose of this guide is to provide basic information about capacitor damage curves and characteristic landmarks necessary for plotting on time-current curves, for the purpose of equipment overcurrent protection.
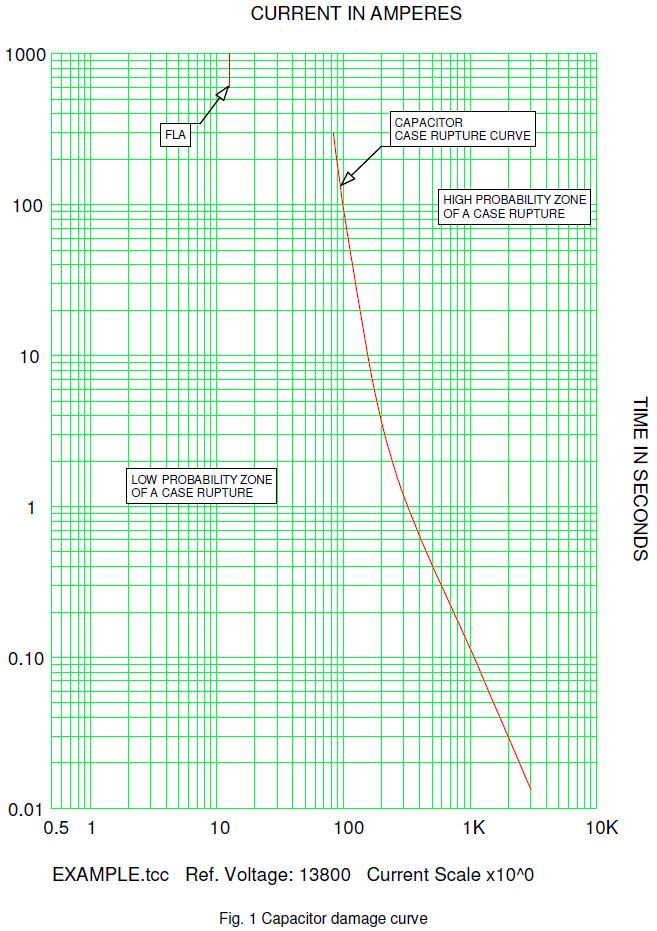
Full Load Amps (FLA)
The FLA is the rated continuous current carrying capacity of a capacitor bank at a referenced ambient temperature and allowable temperature rise. The FLA landmark is located in the top decade of a time-current curve (TCC) at 1000 seconds.
Case Rupture Curve
This curve represents an internal gas pressure limit caused by an internal arcing fault that if exceeded will cause a rupture of the capacitor case. Case rupture data points cannot be calculated by the engineer setting the protective device. The curve is based on the specific design of the capacitor bank and enclosure. Case rupture curves are commonly available from the manufacturer. Faults cleared to the left of a case rupture curve indicate minimal likelihood of a case rupture under fault conditions internal to the capacitor bank. Case rupture curves are plotted in all 5 decades of a TCC.
Example
Plot the characteristic landmarks for a 300kVAR, 13800V, 12.6A capacitor bank.
Solution:
Case rupture data points for the capacitor bank were provided by the manufacture.
| Current (A) | Time (sec.) |
| 275 | 300 |
| 400 | 35 |
| 800 | 2 |
| 4,000 | .08 |
| 10,000 | .0133 |
The results are plotted in Figure 1
References
- Other Application Guides offered by SKM Systems Analysis at www.skm.com
- Electrical Transmission and Distribution Reference Book, ABB Power T&D Company, Raleigh, North Carolina, 1997.
The latest revision of:
- IEEE Std C37.99, IEEE Guide for the Protection of Shunt Capacitor Banks
- IEEE Std 18, IEEE Standard for Shunt Power Capacitors
- IEEE Std 1036, IEEE Guide for the Application of Shunt Power Capacitors
- NEMA Std CP-1, Shunt Capacitors