Equipment Damage Curves Motors |
|||||||||||||||||||||||||||||||||||||||||||||||||||
|
The information presented in this application guide is for review, approval, interpretation and application by a registered professional engineer only. SKM disclaims any responsibility and liability resulting from the use and interpretation of this information. Reproduction of this material is permitted provided proper acknowledgement is given to SKM Systems Analysis Inc. Purpose The purpose of this guide is to provide basic information about motor thermal limit curves and characteristic landmarks necessary for plotting on time-current curves, for the purpose of equipment overcurrent protection. IEEE Std 620 defines the presentation of thermal limit curves for squirrel-cage induction motors. No comparable standard exits for wound-rotor induction or synchronous motors. IEEE Std C37.96 covers protection methods for squirrel-cage induction, wound-rotor induction and synchronous motors. It also defines the running thermal capability, thermal limit curve, accelerating thermal limit and locked rotor thermal limit similar to IEEE Std 620. Presentation of Thermal Limit Curves Machine running overload, accelerating thermal limit and locked rotor thermal limit curves may be provided as a single continuous curve or a set of discontinuous curves. Two sets of thermal limit curves are typically provided. The first set with the machine initially at ambient (cold) temperature followed by a second set with the machine initially at rated operating (hot) temperature. Full Load Amps (FLA) Rated continuous current carrying capacity of a motor at a referenced ambient temperature and allowable temperature rise, see table 1. |
|||||||||||||||||||||||||||||||||||||||||||||||||||
| Table 1 Motor Temperature Ratings | |||||||||||||||||||||||||||||||||||||||||||||||||||
|
|||||||||||||||||||||||||||||||||||||||||||||||||||
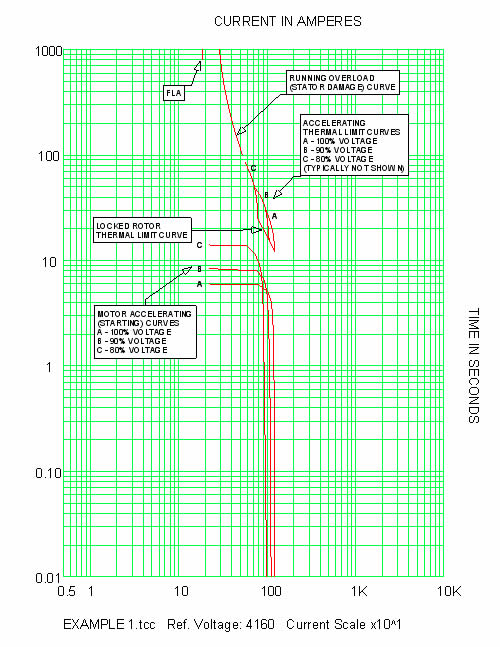
| Accelerating Curve The accelerating curve represents the starting and running ampere characteristic curve of a motor for a given load inertia (Wk2), load torque-speed curve, and starting voltage. Typically, accelerating curves are provided at the motor rated voltage (100%) and the NEMA standard minimum rated locked rotor voltage (90%). If the application requires a lower locked rotor voltage the user must specify the new voltage and the manufacturer must provide the corresponding accelerating curve. Running Overload Curve The running overload (stator damage) curve shall represent the motor thermal capability from rated full-load current to the current at approximately the breakdown torque while running. This curve is not meant as an indication of continuous overload capability, and should never be used to schedule running overload operations. Repeated operation up to and beyond the running overload curve will reduce insulation life. Running overload curves are typically provided for medium-voltage motors. Accelerating Thermal Limit Curve The accelerating thermal limit curve shall represent the motor thermal capability from locked rotor to the current at approximately the breakdown torque while accelerating. Accelerating curves are typically provided for medium-voltage motors. If a motor is required to accelerate and run in both the forward and reverse direction, separate accelerating curves for the forward and reverse direction may be required. Safe Stall Point The safe stall (rotor damage) point represents the maximum time the machine can stay locked without damage at a referenced starting voltage. Safe stall points are typically provided for low-voltage motors. NEMA MG-1 requires motors 500HP and below with a rated voltage not exceeding 1kV shall be capable of withstanding locked-rotor current for not less than 12 seconds when the motor is initially at normal operating temperatures. Locked Rotor Thermal Limit Curve The locked rotor thermal limit (rotor damage) curve shall represent the maximum time the machine can stay locked without damage. The curve is constructed by drawing a line through the rated safe stall points given for a series of referenced starting voltages. Locked rotor curves are typically provided for medium-voltage motors. Example 1 Plot the characteristic landmarks for a 1500HP, 4000V, 2P, 187A, WPII induction motor. Solution The submittal package from the motor manufacturer lists the following starting and thermal limit characteristics for a machine initially at rated operating (hot) temperature. |
|||||||||||||||||||||||||||||||||||||||||||||||||||
| Stator Damage Points: | |||||||||||||||||||||||||||||||||||||||||||||||||||
|
|||||||||||||||||||||||||||||||||||||||||||||||||||
| Rotor Damage Points at 100% Voltage: | |||||||||||||||||||||||||||||||||||||||||||||||||||
|
|||||||||||||||||||||||||||||||||||||||||||||||||||
| Rotor Damage Points at 80% Voltage: | |||||||||||||||||||||||||||||||||||||||||||||||||||
|
|||||||||||||||||||||||||||||||||||||||||||||||||||
| Accelerating Times: | |||||||||||||||||||||||||||||||||||||||||||||||||||
|
|||||||||||||||||||||||||||||||||||||||||||||||||||
| The results are plotted in figure 1. | |||||||||||||||||||||||||||||||||||||||||||||||||||
 |
|||||||||||||||||||||||||||||||||||||||||||||||||||
| Fig. 1 NEMA MV motor TCC landmarks | |||||||||||||||||||||||||||||||||||||||||||||||||||
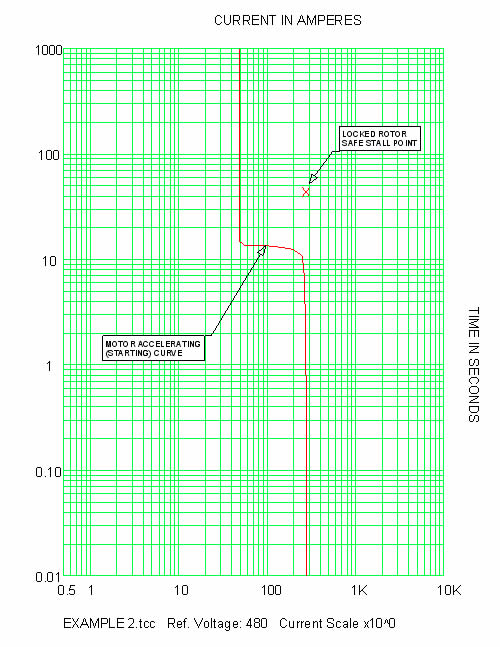
| Example 2 Plot the characteristic landmarks for a 40HP, 460V, 4P, 1.15 SF, TEFC induction motor. Solution The manufacturer’s data sheet lists the following motor performance characteristics. FLA = 49.4 LRA = 275.3 Acceleration time with maximum load inertia at 100% volts = 14.0 seconds Hot safe stall time at 100% volts = 44.0 seconds The results are plotted in figure 2. |
|||||||||||||||||||||||||||||||||||||||||||||||||||
 |
|||||||||||||||||||||||||||||||||||||||||||||||||||
| Fig. 2 NEMA LV motor TCC landmarks | |||||||||||||||||||||||||||||||||||||||||||||||||||
| References | |||||||||||||||||||||||||||||||||||||||||||||||||||
| • Other Application Guides offered by SKM Systems Analysis at www.skm.com | |||||||||||||||||||||||||||||||||||||||||||||||||||
| The latest revision of: | |||||||||||||||||||||||||||||||||||||||||||||||||||
|
• IEEE Std 242, IEEE Recommended Practice for Protection and Coordination of Industrial and Commercial Power Systems (IEEE Buff Book) • IEEE Std 620, IEEE Guide for the Presentation of Thermal Limit Curves for Squirrel Cage Induction Machines • IEEE Std C37.96, IEEE Guide for AC Motor Protection • NEMA MG-1, Motors and Generators |
|||||||||||||||||||||||||||||||||||||||||||||||||||
| Insulating Materials | |||||||||||||||||||||||||||||||||||||||||||||||||||
|
|||||||||||||||||||||||||||||||||||||||||||||||||||
| back to Application guides | |||||||||||||||||||||||||||||||||||||||||||||||||||